Communicating research by visualisation, illustration and storytelling
Time: August 28-September 1
Place: Kalfaret Brygghus, Kalfarveien 76, Bergen
Program: Please download from [ddownload id=”2173″ text=”here” style=”link”]
As a student within the NORBIS network you will during your career work with large and complex data sets, which may result from biological measurements, computational simulation and/or analytical modelling. Being able to translate complicated research into information that can be interpreted, and even understood by a wide range of audiences, is an important skill that will help you throughout your career.
During this summer school, you will learn how to get a better insight into your data through scientific visualisation. Based on this, you will create a scientific illustration that effectively communicates a selected aspect of your research. You will further be coached in oral communication of your research, and finally present your project and illustration for the other participants in a ‘Researcher Grand Prix’ style mini symposium.
The summer school included the following modules:
Links to the material that was presented can be found under each module.
Scientific visualisation:
[one_third]

Noeska Smit
[/one_third]
[two_third]
Computer-based visualisation systems provide visual representations of datasets, intended to help users carry out their tasks more effectively and efficiently. In many disciplines, there is a need for visualisation to help explore, analyse, and present information. Information here could be
[/two_third]
different types of data, such as measurements, simulation results, but also mathematical models of structural- and systems biology. Visualisation is successfully employed in industry and academia in a variety of domains, such as biology, medicine, engineering, and the humanities. Additionally, visualisation has become indispensable when presenting scientific results, such as through the use of figures in papers and presentations. During these sessions, you will learn about basic visualisation principles, gain an overview of different visualisation techniques, and learn how to apply these in a useful way in your own work. These modules are instructed by Associate professor Noeska Smit and post doc Jan Byska, both from the Visualisation group at the Department of Informatics at the University of Bergen. Have a look here at the works of Noeska Smit!
[ddownload id=”2300″ text=”Presentations Noeska Smit” style=”link”]
[ddownload id=”2298″ text=”Presentations Jan Byska” style=”link”]
Visualisation practicals and data sets
Scientific illustration
[one_third]
Pina Kingman
[/one_third]
[two_third]
After learning how to best visualise complex research data, you will now learn how to communicate your results further. Amongst the many effective communication tools at our disposal, illustration is an ideal option. Visually representing research gives the audience an additional perspective. Illustrations tell stories in ways that text cannot, and thus makes complex information more accessible. Illustration itself is also a relatively low-cost, time effective option that can be distributed easily. During these sessions, you will
[/two_third]
learn practical tools to be able to translate your research into a digital illustration. You will further learn the essentials of graphic design and visualisation theory, drawing by hand and drawing digitally. These new theoretical and technical skills will be combined to create an image from a selected aspect of your PhD research. These modules are instructed by Pina Kingman, who is an is an award-winning animator and filmmaker, with a masters degree in Biomedical Communication. Have a look here at her works!
[ddownload id=”2299″ text=”Presentations Pina Kingman” style=”link”]
Scientific presentation
[one_third]
Forskningsdagene i Bergen 2016
[/one_third]
[two_third]
By now, you have pretty good tools to communicate a research finding to your colleagues or even the general public. This session will discuss what good communication means, why storytelling is important and where it may lead. You will receive useful tips and hints on how to present your
[/two_third]
research and how to make it more relevant for an audience. Based on your illustration made during the previous sessions, you will now be coached in the preparation of a short talk, which will ultimately be presented to all participants in a ‘Researcher Grand Prix’ style mini symposium on the last day of the summer school. Communication advisor Synnøve Vindheim Svardal will coach you in your preparations for the flash talk. She is in the mentoring panel of the local Researcher Grand Prix during the Science festival in Bergen and has long standing experience on how to communicate a message.
[ddownload id=”2308″ text=”Presentation Synnøve Vindheim Svardal” style=”link”]
[one_third]
Preview schedule:
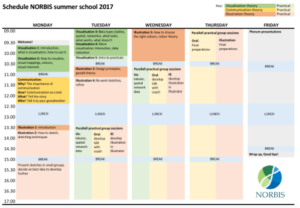
[/one_third]
[one_third]
Poster:
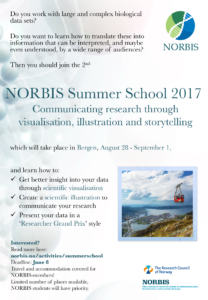
[/one_third]
[one_third]
Full description:
[/one_third]